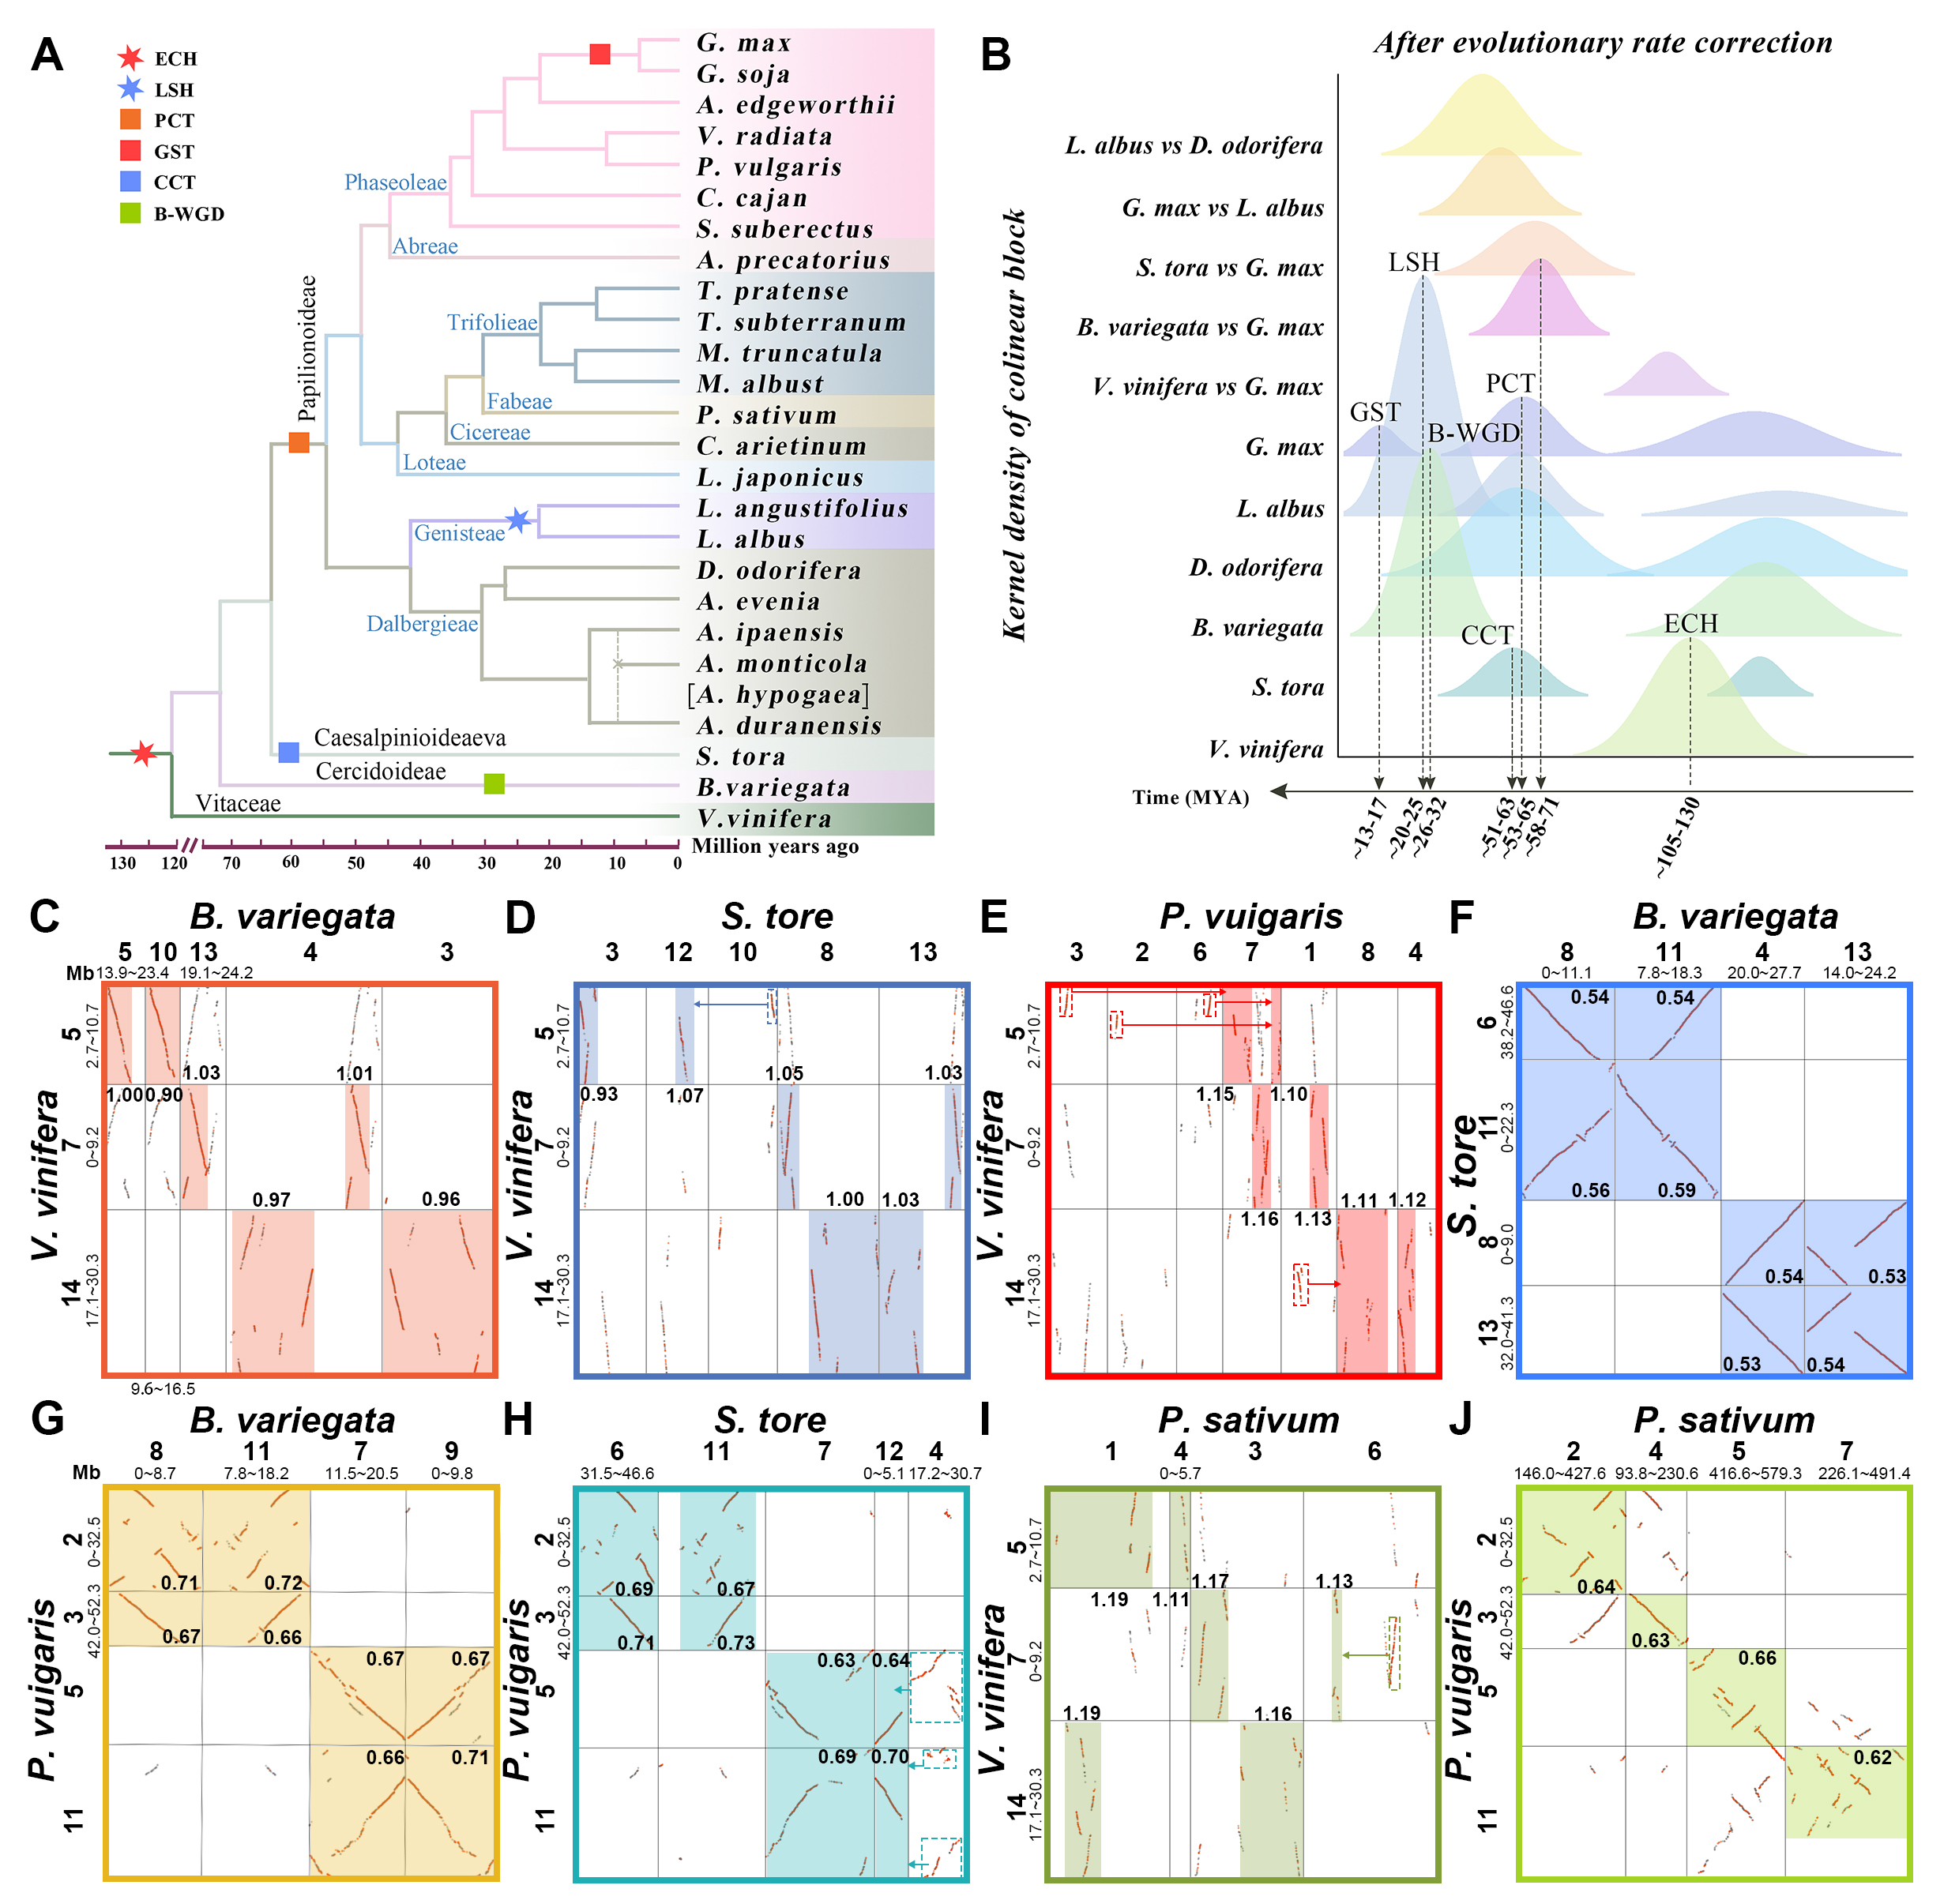
Pair-wise dotplots
To identify polyploid events, we first performed genome-wide BALSTP (E-value <1e-5, score >100) within and between the studied genomes using the software BALST. Then, using CollinearScan software, the best 10 BLASTP matches were selected for inferring gene splicing regions (blocks) within or between genomes. Where the maximum gap was set to 50 spacer genes and large gene families with more than 50 members were removed from the blocks. The median value of synonymous nucleotide substitutions (Ks) for collocated genes was further used to determine the degree of divergence of the identified blocks. We calculated the Ks values between tandem gene pairs using the Bioperl statistical module and the Nei-Gojobori method. We further plotted adjacent gene pairs as dot plots based on genomic location and used different colored dots to distinguish whether the anchor gene pair was the best BLAST hit within/between genomes. We then identified the immediate and paralogous genomic regions within and between genomes based on the generated homology dot plots. Between genomes, a region was identified as an orthologous region if the median Ks of the gene pairs located in that splice region was approximately equal to the value of the Ks peak associated with species differentiation; within genomes, a region was identified as a paralogous region if the median Ks of the gene pairs located in that splice region was approximately equal to the value of the Ks peak associated with a particular polyploidization event. Finally, we can infer the history of WGD by investigating the ratio of syntenic depths within and between genomes.

| Species1 | Species2 | Chr1 | Chr2 | Blastp_dot | Block_dot | Ks_dot |
|---|